
This blog contains instructions on how to set up OpenTelemetry(OTel) instrumentation in your Rust application. OpenTelemetry, also known as OTel for short, is an open-source observability framework that can help you generate and collect telemetry data - traces, metrics, and logs from your Rust application.
Once the telemetry data is generated, you can configure an exporter to send the data to SigNoz for monitoring and visualization.
There are three major steps to using OpenTelemetry:
- Instrumenting your Rust application with OpenTelemetry
- Configuring the exporter to send data to SigNoz
- Validating that configuration to ensure that data is being sent as expected.
In this tutorial, we will instrument a Rust application for traces and send it to SigNoz.
Requirements
Send traces to SigNoz Cloud
Based on your application environment, you can choose the setup below to send traces to SigNoz Cloud.
- VM
- Kubernetes
From VMs, there are two ways to send data to SigNoz Cloud.
Send traces directly to SigNoz cloud
Here we will be sending traces to SigNoz cloud in 4 easy steps, if you want to send traces to self hosted SigNoz , you can refer to this article.
If you are using the sample Rust application as base app, then you just need to update .env file and you are good to go! For Detailed info read walkthrough
If you don't have a Rust application you can use our sample Rust application, To configure our Rust application to send data we need to initialize OpenTelemetry, Otel has already created some crates which you need to add into your Cargo.toml file, just below [dependencies] section.
opentelemetry = { version = "0.18.0", features = ["rt-tokio", "metrics", "trace"] }
opentelemetry-otlp = { version = "0.11.0", features = ["trace", "metrics"] }
opentelemetry-semantic-conventions = { version = "0.10.0" }
opentelemetry-proto = { version = "0.1.0"}
tokio = { version = "1", features = ["full"] }
tonic = { version = "0.8.2", features = ["tls-roots"] }
after adding these in Cargo.toml , you need to use these in entry point of your Rust application , which is main.rs file in majority of applications.
use opentelemetry::global::shutdown_tracer_provider;
use opentelemetry::sdk::Resource;
use opentelemetry::trace::TraceError;
use opentelemetry::{
    global, sdk::trace as sdktrace,
    trace::{TraceContextExt, Tracer},
    Context, Key, KeyValue,
};
use opentelemetry_otlp::WithExportConfig;
use tonic::metadata::{MetadataMap, MetadataValue};
Add this function in main.rs file, init_tracer is initializing an OpenTelemetry tracer with the OpenTelemetry OTLP exporter which is sending data to SigNoz Cloud.
fn init_tracer() -> Result<sdktrace::Tracer, TraceError> {
    let signoz_access_token = std::env::var("SIGNOZ_ACCESS_TOKEN").expect("SIGNOZ_ACCESS_TOKEN not set");
    let mut metadata = MetadataMap::new();
    metadata.insert(
        "signoz-access-token",
        MetadataValue::from_str(&signoz_access_token).unwrap(),
    );
    opentelemetry_otlp::new_pipeline()
        .tracing()
        .with_exporter(
            opentelemetry_otlp::new_exporter()
                .tonic()
                .with_metadata(metadata)
                .with_endpoint(std::env::var("SIGNOZ_ENDPOINT").expect("SIGNOZ_ENDPOINT not set")),
        )
        .with_trace_config(
            sdktrace::config().with_resource(Resource::new(vec![
                KeyValue::new(
                    opentelemetry_semantic_conventions::resource::SERVICE_NAME,
                    std::env::var("APP_NAME").expect("APP_NAME not set"),
                ),
            ])),
        )
        .install_batch(opentelemetry::runtime::Tokio)
}
After adding this function, you need to create a .env file in root of project , the structure should look like this.
project_root/
|-- Cargo.toml
|-- src/
|   |-- main.rs
|-- .env
Paste these in .env file
PORT=3000
APP_NAME=rust-sample
SIGNOZ_ENDPOINT=https://ingest.[region].signoz.cloud:443/v1/traces
SIGNOZ_ACCESS_TOKEN=XXXXXXXXXX
| Variable | Description |
|---|---|
| PORT (Optional) | If it is a web app pass port or else you can ignore this variable |
| APP_NAME * | Name you want to give to your rust application |
| SIGNOZ_ENDPOINT * | This is ingestion URL which you must have got in mail after registering on SigNoz cloud |
| SIGNOZ_ACCESS_TOKEN * | This is Ingestion Key which you must have got in mail after registering on SigNoz cloud |
Open your Cargo.toml file and paste these below [dependencies]
dotenv = "0.15.0"
Import these at top, so you can use variables from .env file
use dotenv::dotenv;
After importing , just call these functions inside main() function by pasting this at starting of main() function
    dotenv().ok();
    let _ = init_tracer();
also change
fn main(){
    //rest of the code
}
to
#[tokio::main]
async fn main() {
    //rest of the code
}
Now comes the most interesting part, Sending data to SigNoz to get sense of your traces. After adding the below block you can send data to SigNoz cloud
  let tracer = global::tracer("global_tracer");
    let _cx = Context::new();

    tracer.in_span("operation", |cx| {
        let span = cx.span();
        span.set_attribute(Key::new("KEY").string("value"));

        span.add_event(
            format!("Operations"),
            vec![
                Key::new("SigNoz is").string("Awesome"),
            ],
        );
    });
    shutdown_tracer_provider()
Go to your .env file and update the value of required variables i.e
APP_NAME,
SIGNOZ_ENDPOINT and
SIGNOZ_ACCESS_TOKEN
Now run cargo run in terminal to start the application!
Send traces via OTel Collector binary
OTel Collector binary helps to collect logs, hostmetrics, resource and infra attributes. It is recommended to install Otel Collector binary to collect and send traces to SigNoz cloud. You can correlate signals and have rich contextual data through this way.
You can find instructions to install OTel Collector binary here in your VM. Once you are done setting up your OTel Collector binary, you can follow the below steps for instrumenting your Javascript application.
If you don't have a Rust application you can use our sample Rust application, To configure our Rust application to send traces we need to initialize OpenTelemetry, Otel has already created some crates which you need to add into your Cargo.toml file, just below [dependencies] section.
opentelemetry = { version = "0.18.0", features = ["rt-tokio", "metrics", "trace"] }
opentelemetry-otlp = { version = "0.11.0", features = ["trace", "metrics"] }
opentelemetry-semantic-conventions = { version = "0.10.0" }
opentelemetry-proto = { version = "0.1.0"}
tokio = { version = "1", features = ["full"] }
tonic = { version = "0.8.2", features = ["tls-roots"] }
after adding these in Cargo.toml , you need to use these in entry point of your Rust application , which is main.rs file in majority of applications.
use opentelemetry::global::shutdown_tracer_provider;
use opentelemetry::sdk::Resource;
use opentelemetry::trace::TraceError;
use opentelemetry::{
    global, sdk::trace as sdktrace,
    trace::{TraceContextExt, Tracer},
    Context, Key, KeyValue,
};
use opentelemetry_otlp::WithExportConfig;
use tonic::metadata::{MetadataMap, MetadataValue};
Add this function in main.rs file, init_tracer is initializing an OpenTelemetry tracer with the OpenTelemetry OTLP exporter which is sending data to SigNoz Cloud.
This tracer initializes the connection with the OTel collector from the system variables passed while starting the app.
fn init_tracer() -> Result<sdktrace::Tracer, TraceError> {
    opentelemetry_otlp::new_pipeline()
        .tracing()
        .with_exporter(opentelemetry_otlp::new_exporter().tonic().with_env())
        .with_trace_config(
            sdktrace::config().with_resource(Resource::default()),
        )
        .install_batch(opentelemetry::runtime::Tokio)
}
You need call init_tracer function inside main() at starting so that as soon as your rust application starts, tracer will be available globally.
let _ = init_tracer();
also change
fn main(){
    //rest of the code
}
to
#[tokio::main]
async fn main() {
    //rest of the code
}
Now comes the most interesting part, Sending data to SigNoz to get sense of your traces. After adding the below block you can send traces to SigNoz cloud
  let tracer = global::tracer("global_tracer");
    let _cx = Context::new();

    tracer.in_span("operation", |cx| {
        let span = cx.span();
        span.set_attribute(Key::new("KEY").string("value"));

        span.add_event(
            format!("Operations"),
            vec![
                Key::new("SigNoz is").string("Awesome"),
            ],
        );
    });
    shutdown_tracer_provider()
| Variable | Description |
|---|---|
| OTEL_EXPORTER_OTLP_ENDPOINT | This is the endpoint of your OTel Collector. If you have hosted it somewhere, provide the URL. Otherwise, the default is http://localhost:4317 if you have followed our guide. |
| OTEL_RESOURCE_ATTRIBUTES=service.name | Specify as the value. This will be the name of your Rust application on SigNoz services page, allowing you to uniquely identify the application traces. |
Now run
OTEL_EXPORTER_OTLP_ENDPOINT=http://localhost:4317 OTEL_RESOURCE_ATTRIBUTES=service.name=sample-rust-app cargo run
in terminal to start the application!
For Javascript application deployed on Kubernetes, you need to install OTel Collector agent in your k8s infra to collect and send traces to SigNoz Cloud. You can find the instructions to install OTel Collector agent here.
Once you have set up OTel Collector agent, you can proceed with OpenTelemetry Javascript instrumentation by following the below steps:
Step 1 : Instrument your application with OpenTelemetryIf you don't have a Rust application you can use our sample Rust application, To configure our Rust application to send traces we need to initialize OpenTelemetry, Otel has already created some crates which you need to add into your Cargo.toml file, just below [dependencies] section.
opentelemetry = { version = "0.18.0", features = ["rt-tokio", "metrics", "trace"] }
opentelemetry-otlp = { version = "0.11.0", features = ["trace", "metrics"] }
opentelemetry-semantic-conventions = { version = "0.10.0" }
opentelemetry-proto = { version = "0.1.0"}
tokio = { version = "1", features = ["full"] }
tonic = { version = "0.8.2", features = ["tls-roots"] }
after adding these in Cargo.toml , you need to use these in entry point of your Rust application , which is main.rs file in majority of applications.
use opentelemetry::global::shutdown_tracer_provider;
use opentelemetry::sdk::Resource;
use opentelemetry::trace::TraceError;
use opentelemetry::{
    global, sdk::trace as sdktrace,
    trace::{TraceContextExt, Tracer},
    Context, Key, KeyValue,
};
use opentelemetry_otlp::WithExportConfig;
use tonic::metadata::{MetadataMap, MetadataValue};
Add this function in main.rs file, init_tracer is initializing an OpenTelemetry tracer with the OpenTelemetry OTLP exporter which is sending data to SigNoz Cloud.
This tracer initializes the connection with the OTel collector from the system variables passed while starting the app.
fn init_tracer() -> Result<sdktrace::Tracer, TraceError> {
    opentelemetry_otlp::new_pipeline()
        .tracing()
        .with_exporter(opentelemetry_otlp::new_exporter().tonic().with_env())
        .with_trace_config(
            sdktrace::config().with_resource(Resource::default()),
        )
        .install_batch(opentelemetry::runtime::Tokio)
}
You need call init_tracer function inside main() at starting so that as soon as your rust application starts, tracer will be available globally.
let _ = init_tracer();
also change
fn main(){
    //rest of the code
}
to
#[tokio::main]
async fn main() {
    //rest of the code
}
Now comes the most interesting part, Sending data to SigNoz to get sense of your traces. After adding the below block you can send traces to SigNoz cloud
  let tracer = global::tracer("global_tracer");
    let _cx = Context::new();

    tracer.in_span("operation", |cx| {
        let span = cx.span();
        span.set_attribute(Key::new("KEY").string("value"));

        span.add_event(
            format!("Operations"),
            vec![
                Key::new("SigNoz is").string("Awesome"),
            ],
        );
    });
    shutdown_tracer_provider()
| Variable | Description |
|---|---|
| OTEL_EXPORTER_OTLP_ENDPOINT | This is the endpoint of your OTel Collector via which you will send traces, as you have already installed it the default endpoint is http://localhost:4317 |
| OTEL_RESOURCE_ATTRIBUTES=service.name | Specify as the value. This will be the name of your Rust application on SigNoz services page, allowing you to uniquely identify the application traces. |
Now run
OTEL_EXPORTER_OTLP_ENDPOINT=http://localhost:4317 OTEL_RESOURCE_ATTRIBUTES=service.name=sample-rust-app cargo run
in terminal to start the application!
Example Walkthrough
Clone the sample rust application by running the following command:
git clone https://github.com/anukulpandey/sample-rust-otel
cd sample-rust-otel
cp .env.sample .env
Change the environment variables , most important are Ingestion Key and Ingestion Url in .env file.
To start the application run the following command cargo run, it will display this in terminal

Now go to http://localhost:3000 and you will see this.
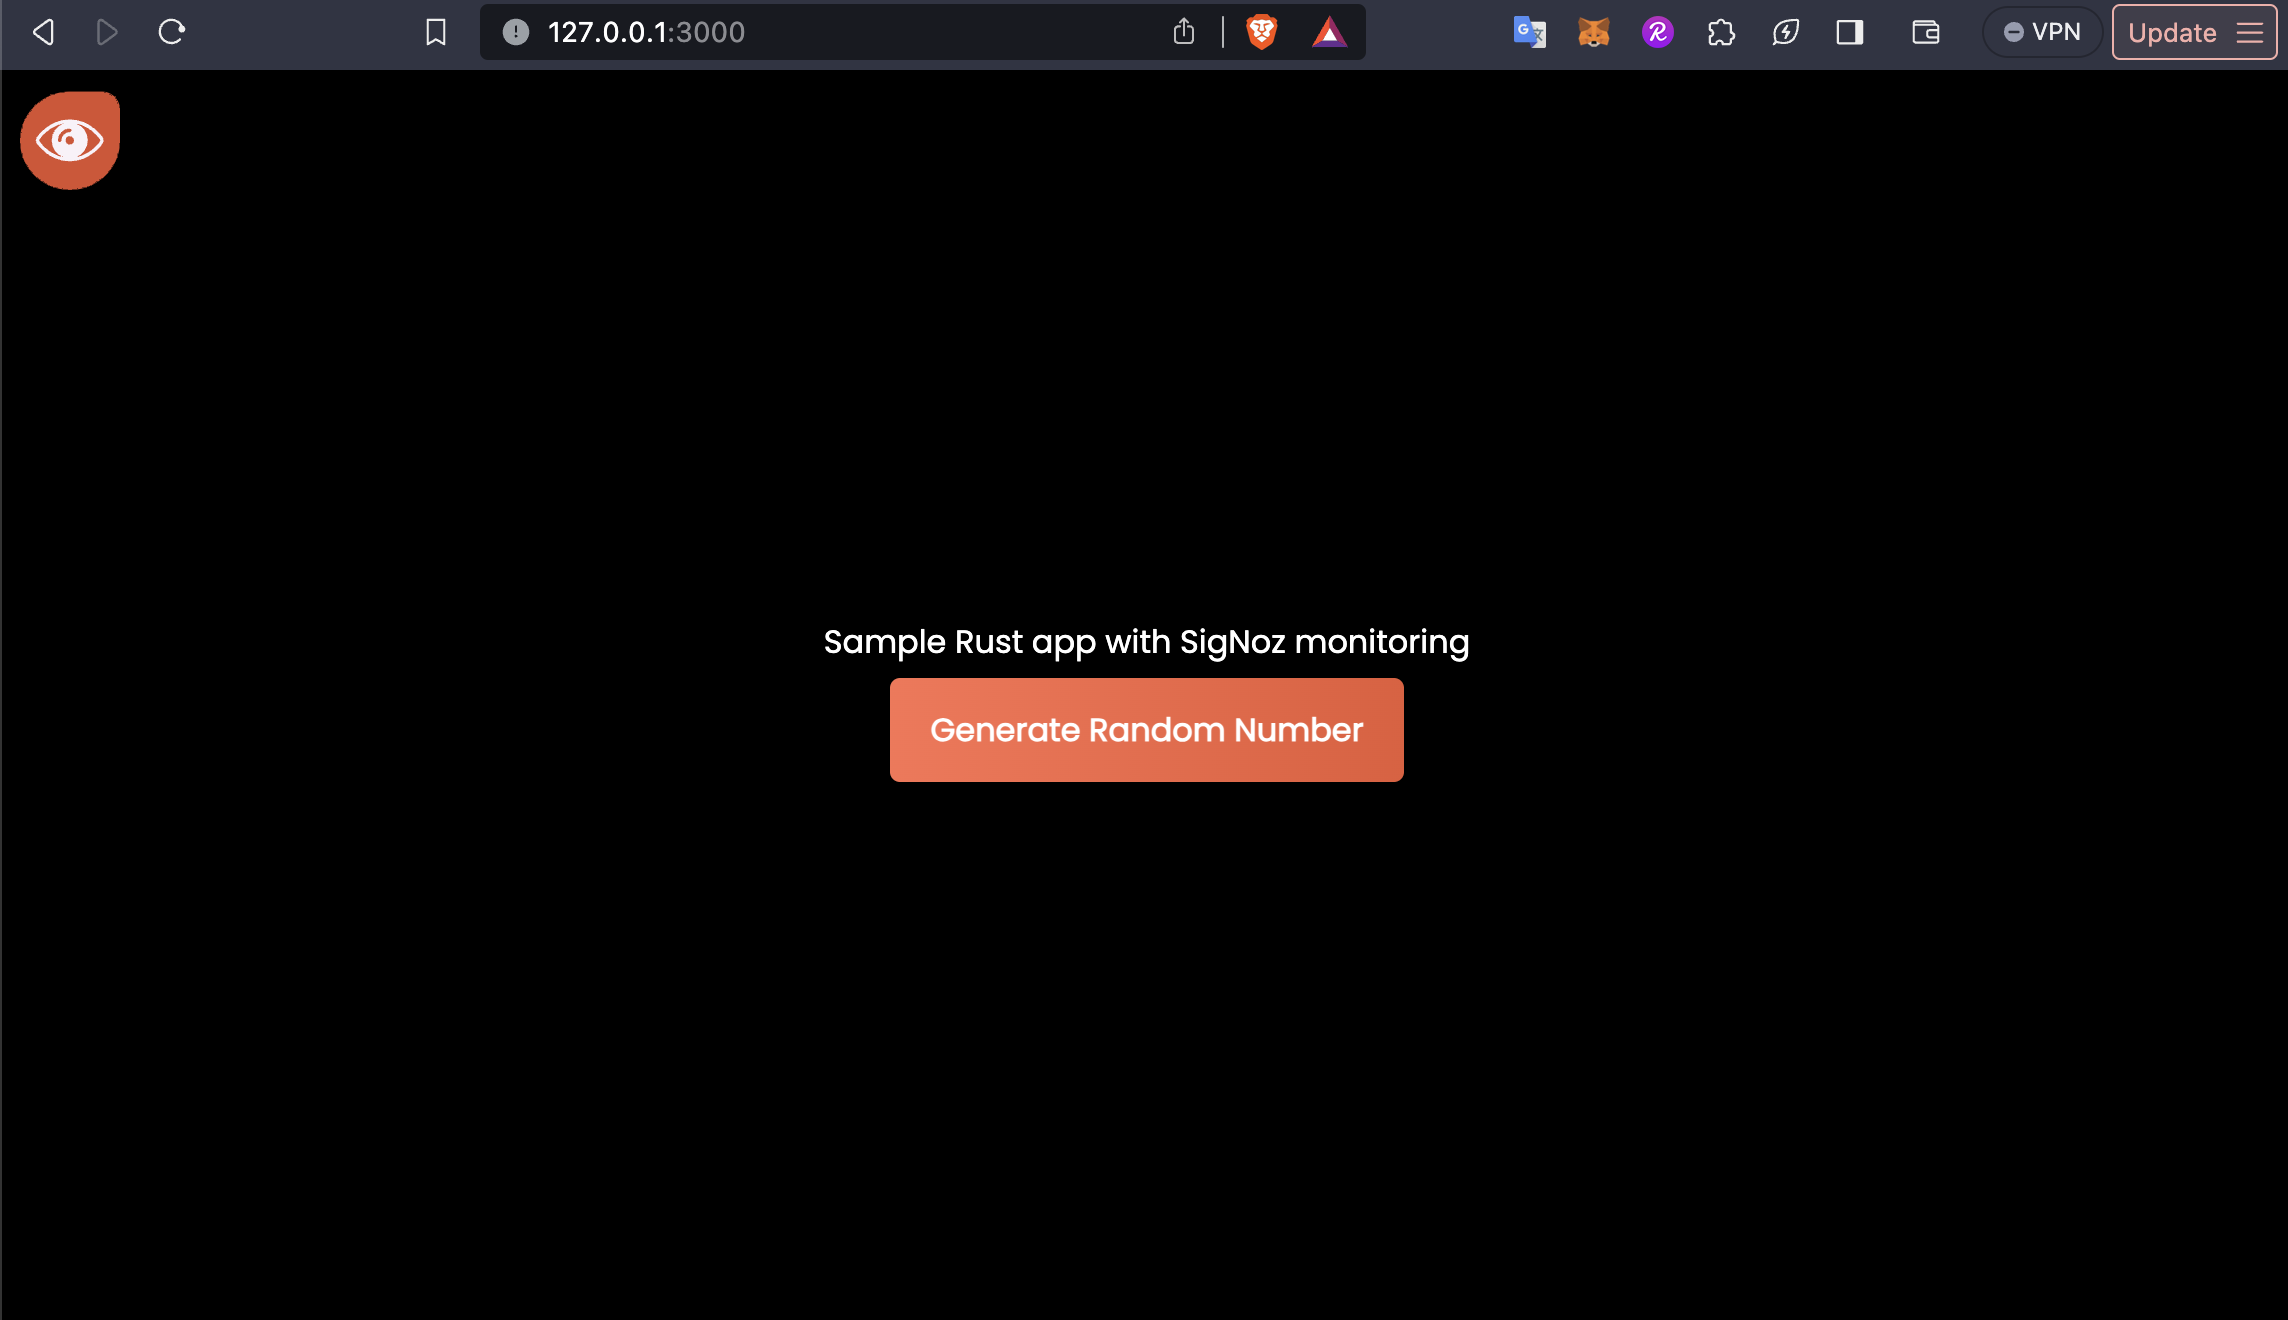
By now Rust application must have sent some data to SigNoz but let's explore this sample app more , click on the button and it will generate some random no.
Now go to SigNoz cloud and login. You must be able to see something like this
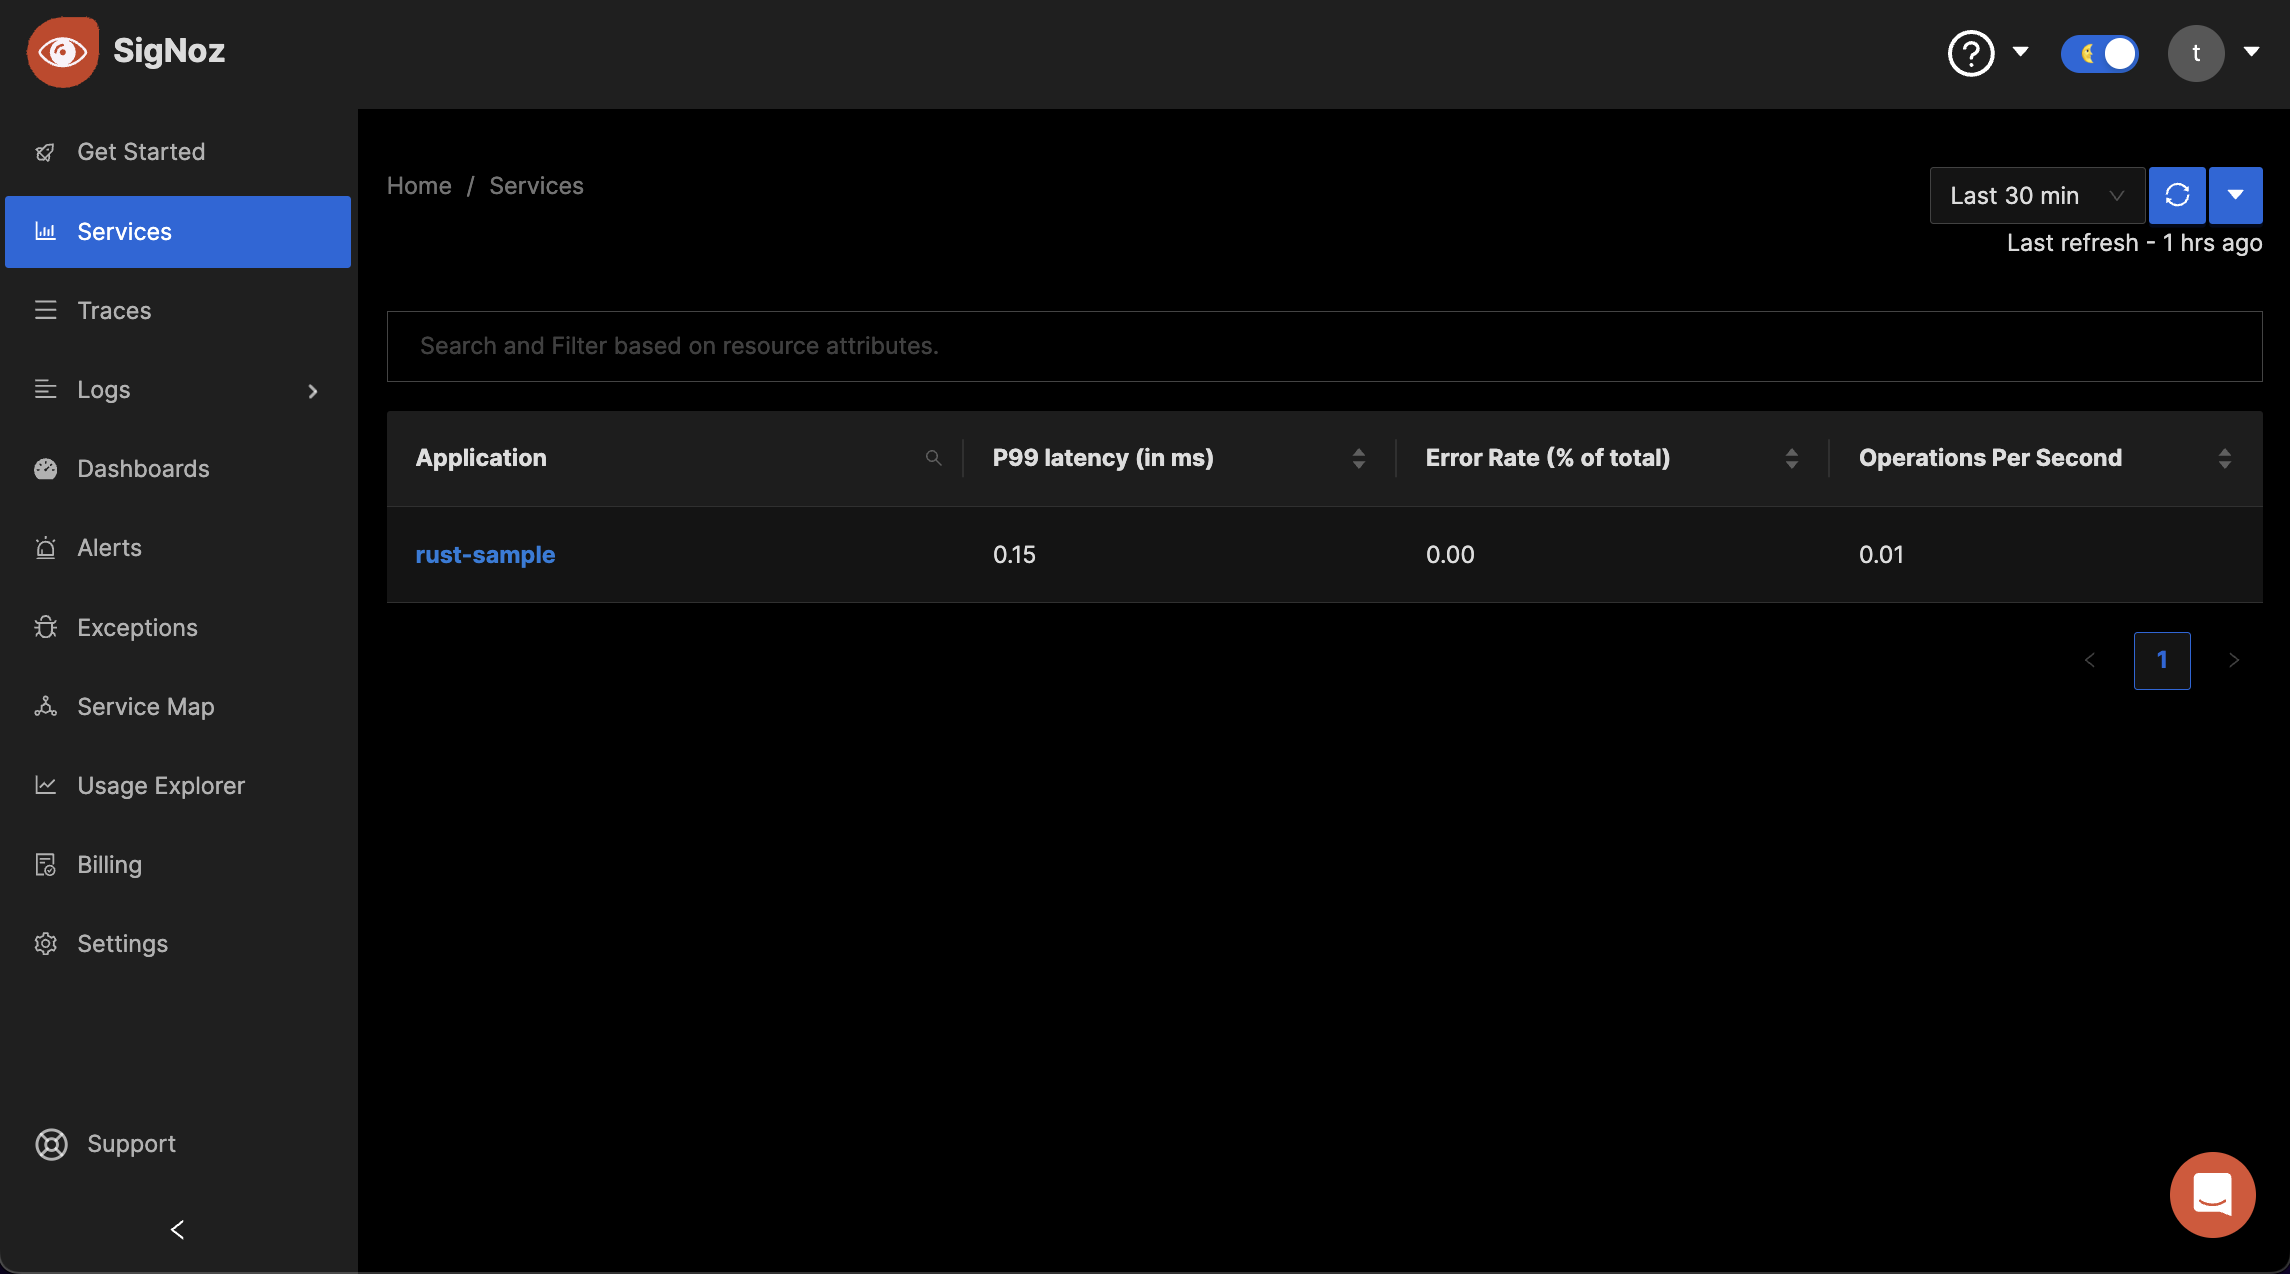
Instead of rust-sample you might be seeing another name if you changed it in .env file. Click on this , Now you will see a dashboard like this , see at bottom right on Key Operations, click on any of the operation
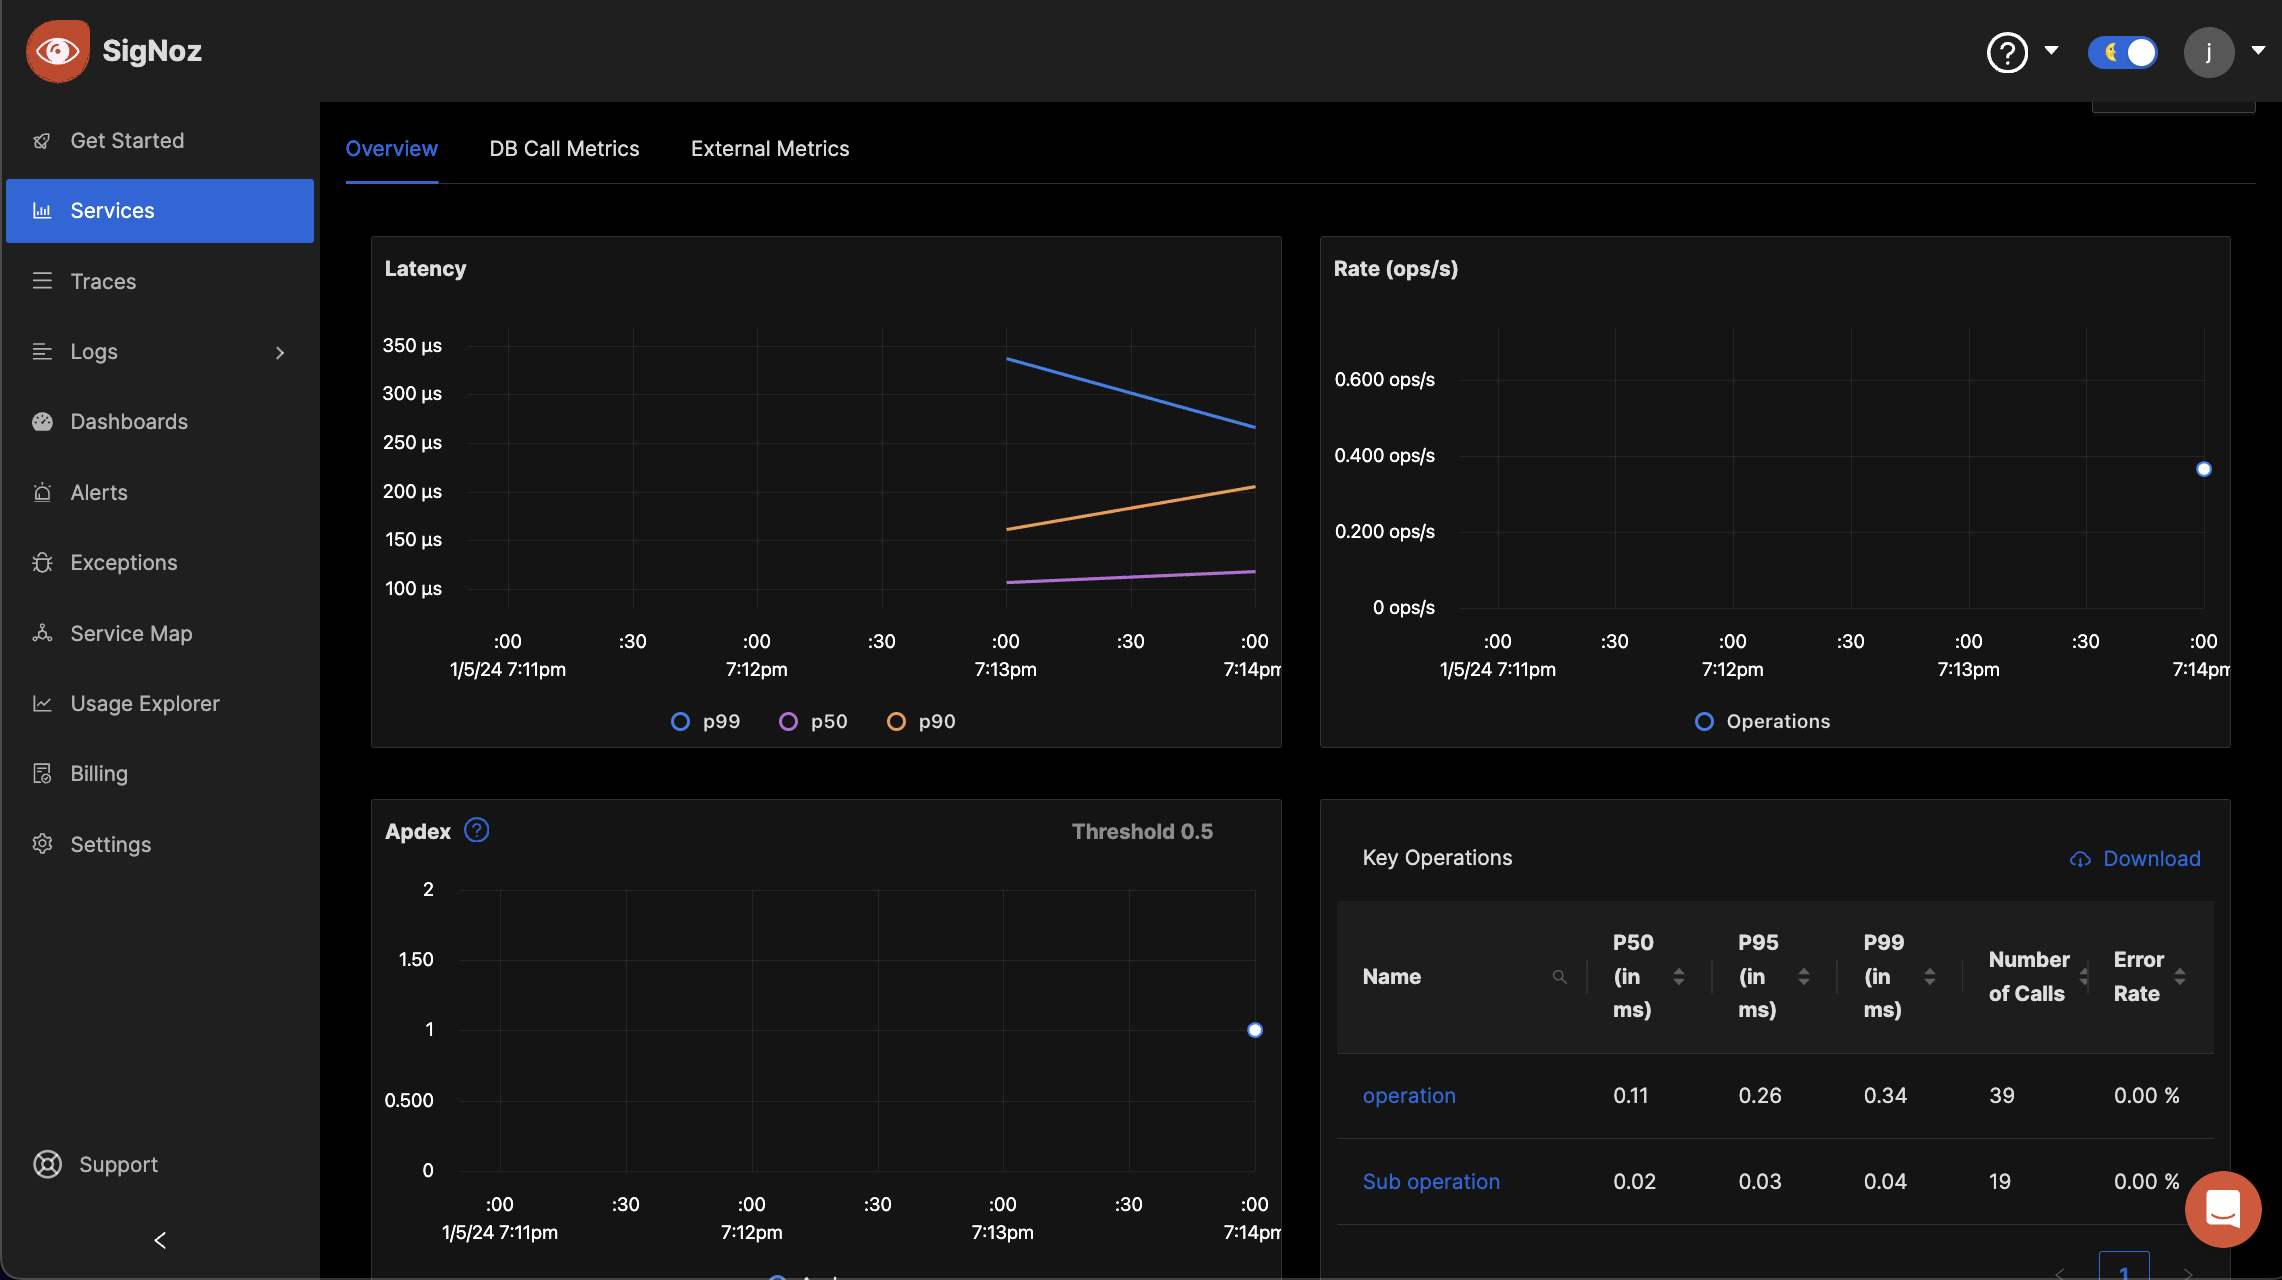
You will see something like below
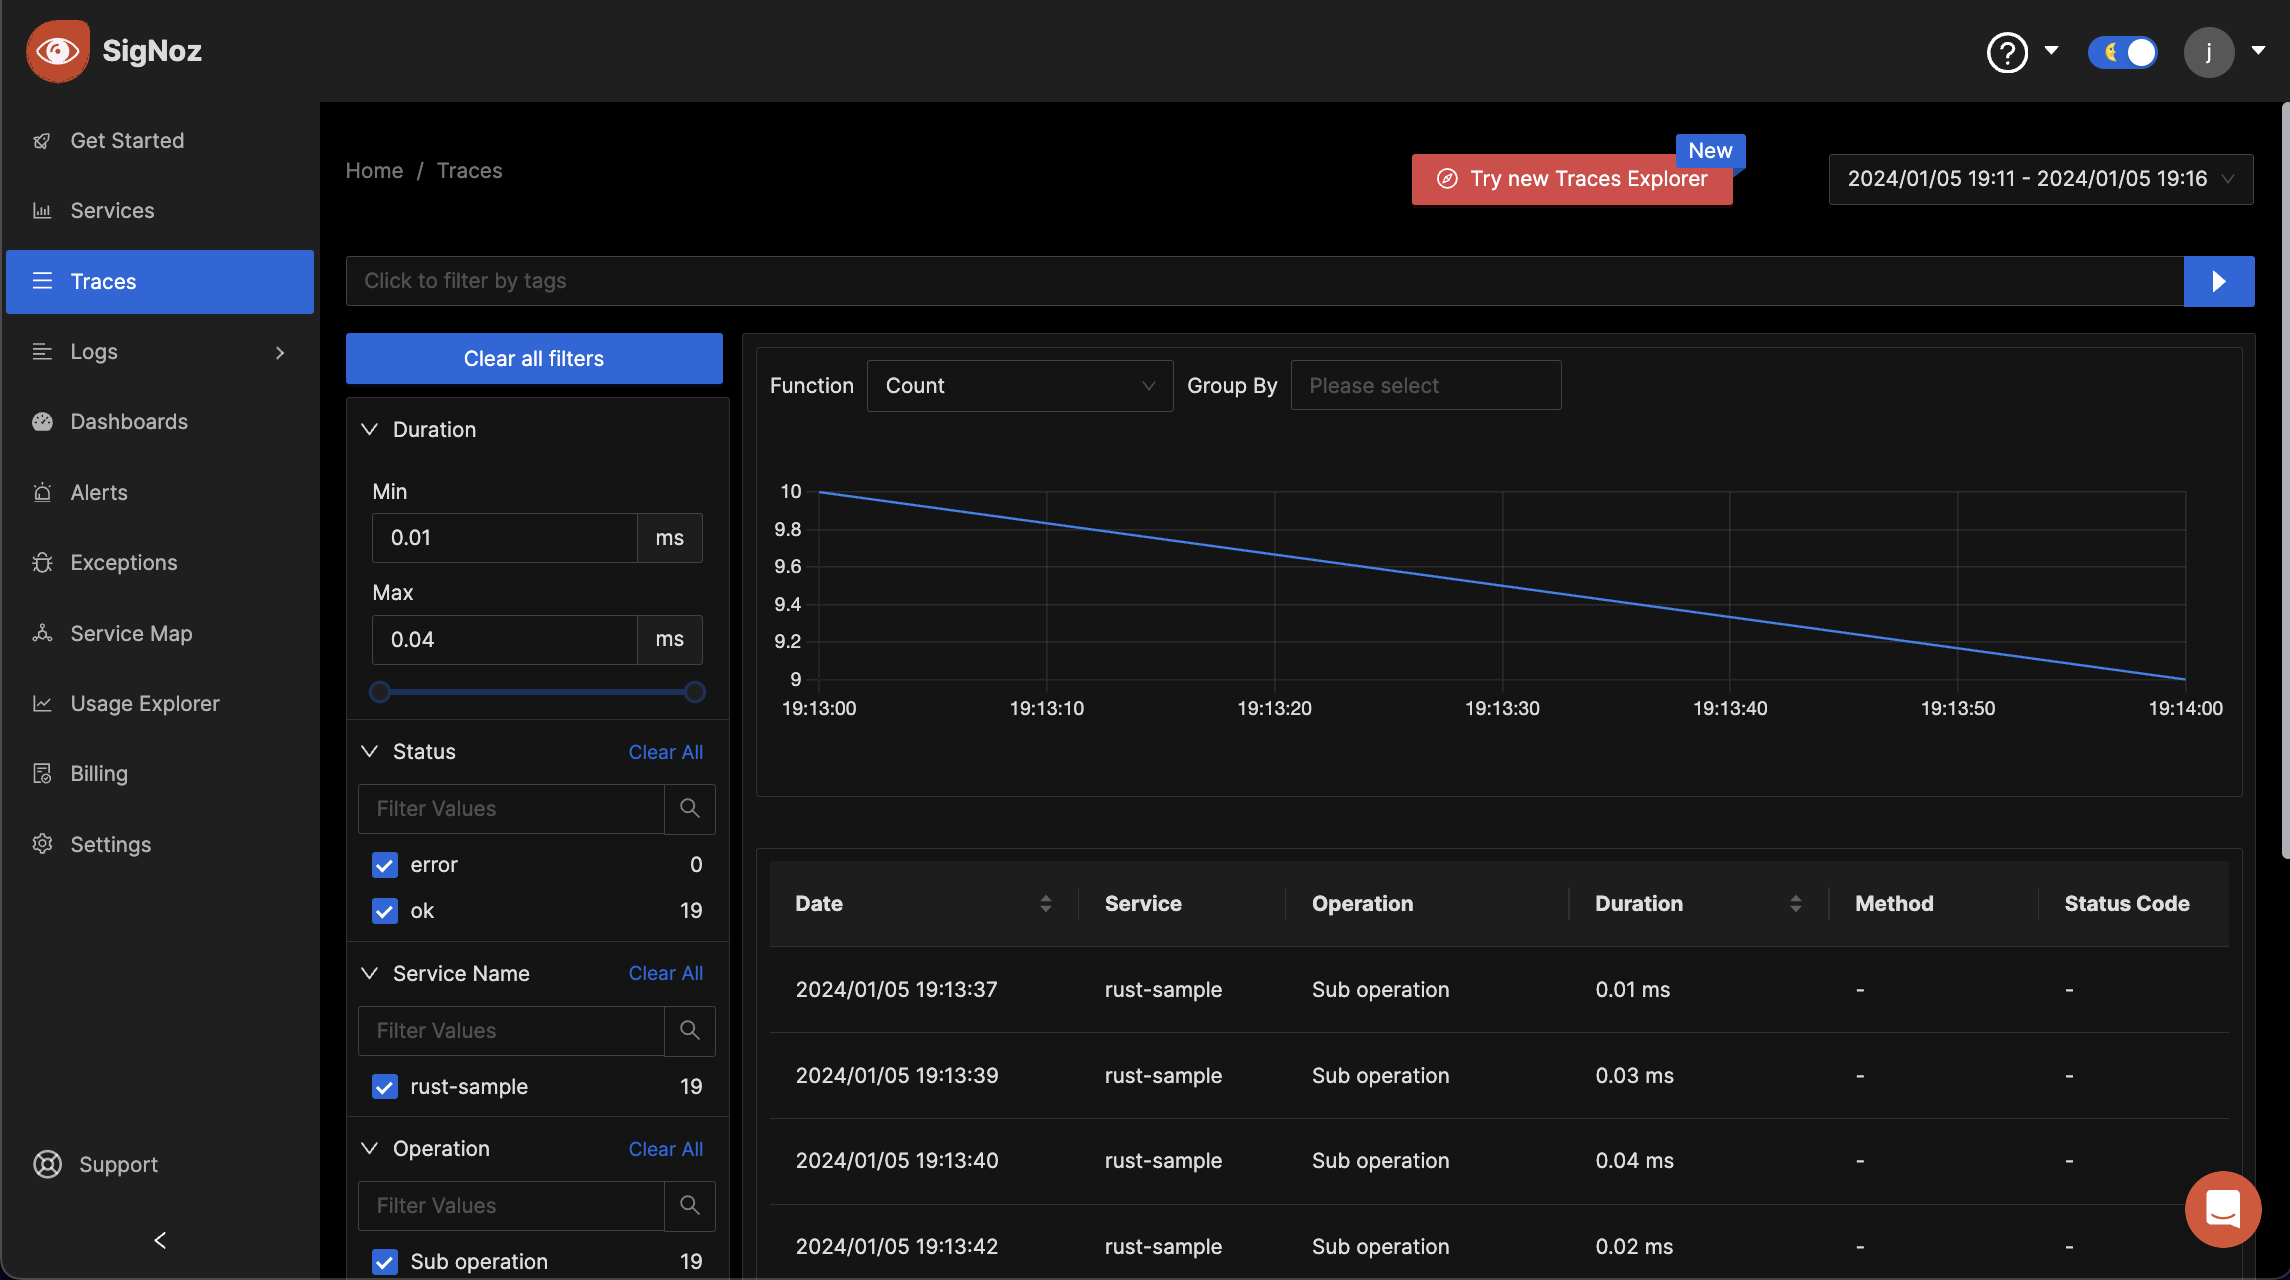
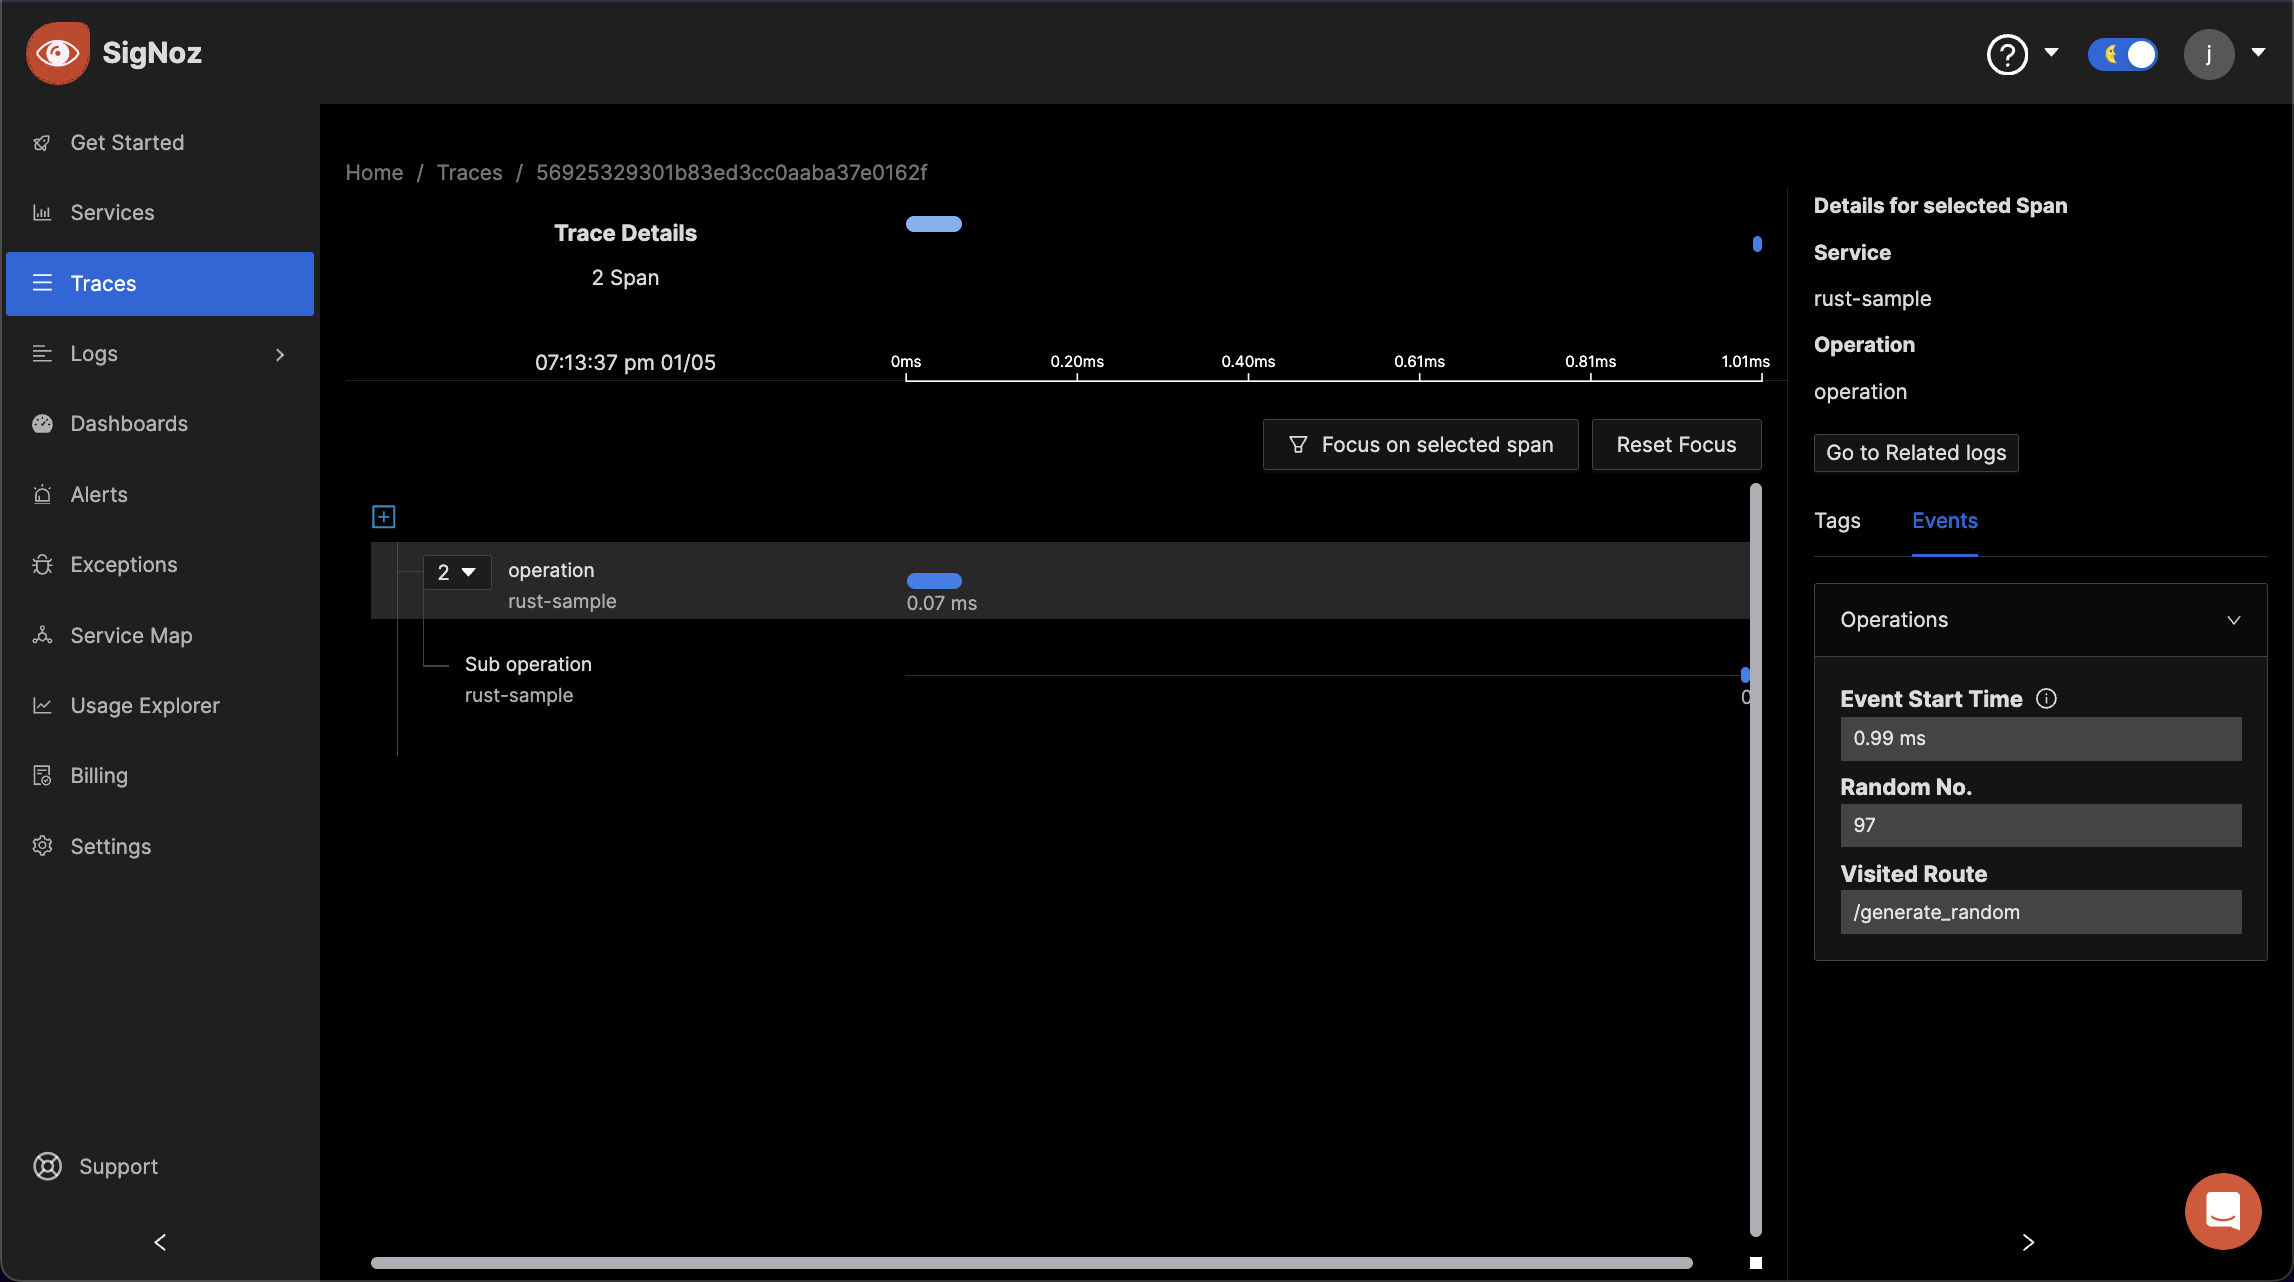
You can play around with these, and after clicking on any of the operation you will see a more detailed representation. For example , this the random no. I generated , and the route I visited etc.
Conclusion
This tutorial demonstrates how you can instrument your rust application and monitor traces in SigNoz, for advanced telemetry you can refer to the official docs by Opentelemetry.